

Table of contents


No headings in the article.
As the data around us continues to become more available, it continues to grow both in amount and complexity, as does the need for an effective process to derive the value the data holds. This value is derived through data analysis. The data analysis process typically moves through several iterative phases which we have grouped into 5 different steps.
But first, what is data analysis?
Data analysis is the process of collecting, cleaning, modelling, analyzing, interpreting, and visualizing data to extract insights that support decision-making using various techniques and business intelligence tools.
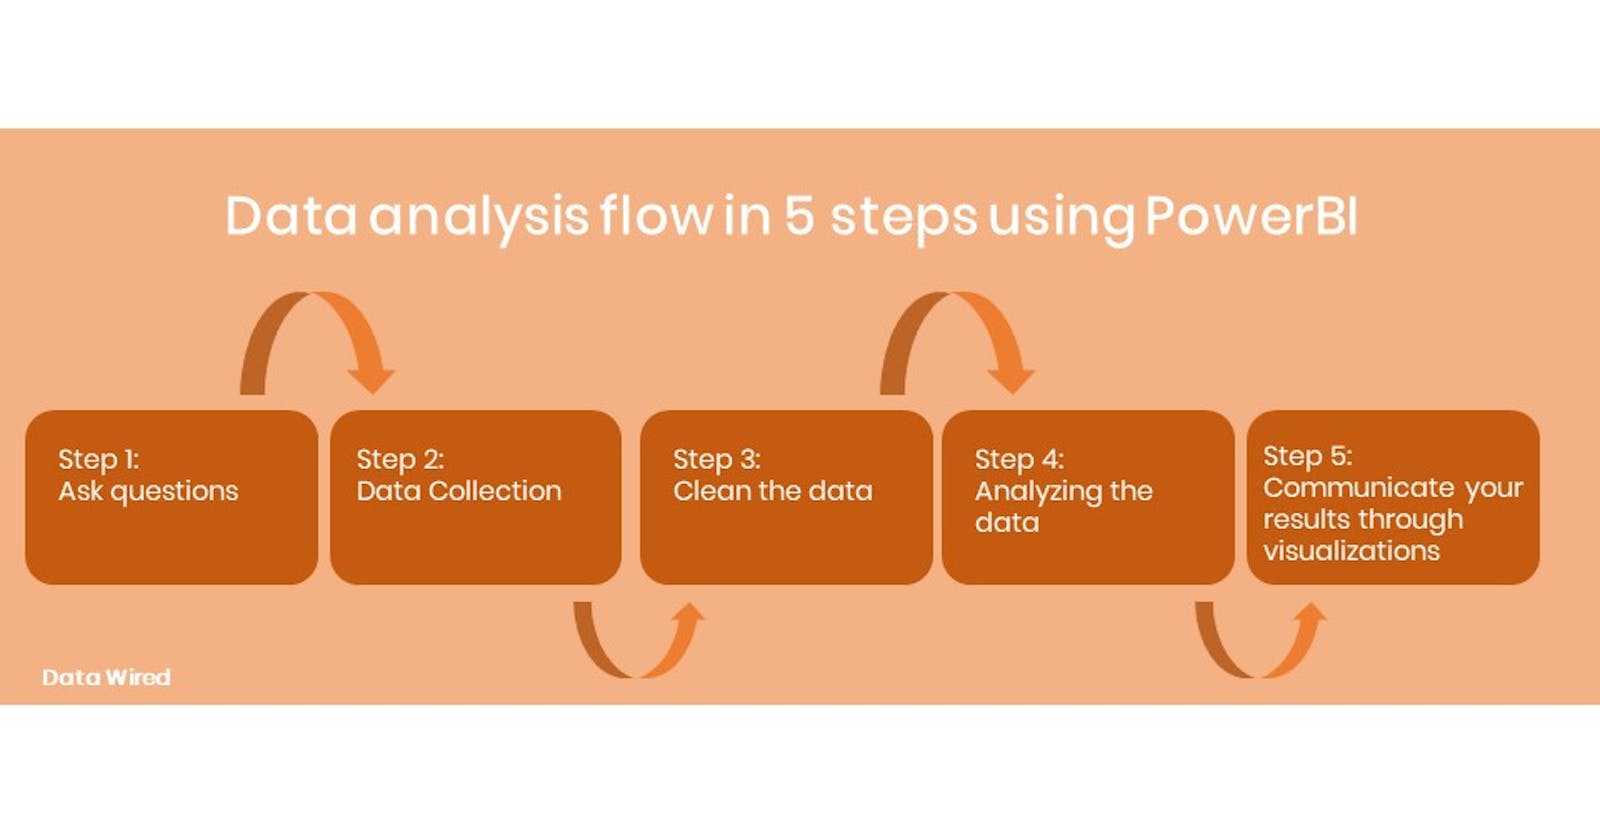
In this article, we’ll explain the different stages of the data analysis process. The article is aimed at helping you understand what happens at each step in the data analysis process flow. When you’re done, you’ll have a great understanding of the analysis flow which you may start incorporating even in your daily tasks. Here are the 5 steps we’ll go through:
Step 1: Ask questions
Step 2: Data Collection
Step 3: Cleaning the data
Step 4: Analyzing the data
Step 5: Communicate your results
Step 1: Ask questions
Questions help you identify the data you need to collect or use and help you focus on relevant parts of your data and direct your analysis towards meaningful insights. For example: What outcomes do you want to achieve? What specific issues would you like to address? For subscription-based businesses, you might want to ask, what are the causes of customer churn and how can you reduce it? For an oncology centre you might want to ask, what size range of each tumor feature determines that a tumor is cancerous ? For a sales business you might want to ask, does an increase in revenue lead to an increase in profit ? Or a business might what to find out possible future consumer behavior
Step 2: Data Collection
Once you understand the questions that you need to answer the focus of your analysis, you need to define the type of data you need and collect the appropriate data. This might be quantitative (numeric) data, e.g. sales figures, or qualitative (descriptive) data, such as customer surveys and reviews. This data may be collected internally or externally. Internal data is data directly collected by the company you’re doing the analysis for (First - party data). External data is data collected from other companies (Second-party data) or data generated from multiple sources which are usually open data repositories (Third-party data).
The next step is for you to import this data into PowerBI desktop. Open PowerBI and open the Get Data dialog box directly by selecting the Get Data icon itself. You will find multiple options of importing data from different data sources.

This step is important because the nature of the collected data sources determines how in-depth the analysis is. You need to make sure you have enough data to solve the questions.
Step 3: Cleaning the Data
Once you have collected the data, you need to prepare it for analysis. This is called data cleaning. Data cleaning is a vital step in the data analysis process because the accuracy of your analysis will depend on the quality of your data. This process involves checking for incompleteness or inconsistencies and removing incorrect data. Clean data should have the characteristics below:
Free from missing values (nulls)
Typos/data entry errors are corrected
No duplicated data
Irrelevant Data is excluded
Outliers are dealt with (Kept at a certain value)
Correct data types for all columns
Column and table names are short and descriptive
Consistently formatted
In powerBI, cleaning data is done through powerQuery. A data manipulation framework present in PowerBI which allows us to connect to and transform our data according to our needs in a series of transformations. Below are images of some power query functions that are used to clean data.


Step 4: Analyzing/Interpreting the data (Exploratory, Descriptive, Diagnostic, Predictive and Prescriptive analysis)
Once the data is clean, you can start analyzing the data.The type of data analysis you carry out largely depends on what your goal is.
The first step is to carry out exploratory analysis. This process will determine if your data is appropriate and ready for the next stages through further sorting. This process will help you Uncover and resolve data quality issues such as detecting anomalies in your data set as well as understand existing patterns and correlations between variables. In this stage you may also create new variables and measures that will help you with the steps that will follow. New variables and measures are created using DAX( Data Analysis Expressions). DAX is a programming language that is used throughout Microsoft Power BI for creating calculated columns, measures, and custom tables. It is a collection of functions, operators, and constants that can be used in a formula, or expression, to calculate and return one or more values. Below is a snapshot of what a DAX function looks like.
Churned = IF('Databel - Data'[Churn Label]="Yes", 1, 0)
The next step is to carry out descriptive analysis which identifies what has already happened. An example of this for a subscription based business concerned with customer churn, would be identifying that Region A has 15% customer churn. This summary will help you determine how to proceed.
After descriptive analytics, you will need to carry out diagnostic analysis which focuses on understanding why we have the reasons for the results shown from the descriptive analysis. For instance, the reason for a 15% customer churn within region A would be because of competitors having better customer service and cheaper products.
Another step is to carry out predictive analysis, this will allow you to identify future trends based on the historical data in your dataset. This type of analysis is commonly used to forecast future activity. For example, which customer demographic group is more likely to churn ?
The last process of step 4 includes prescriptive analysis which allows you to make recommendations for the future. It incorporates aspects of all the other analyses.
Step 5: Communicating/ Sharing your results
The final step of the entire analysis process is to share your insights. This involves presenting them in a manner that is understandable for everyone within the audience who will be receiving the analysis. In PowerBI, this is done through data storytelling, which involves turning your data into a compelling narrative. This will be through visualization using dashboards and reports.
An example of a dashboard for customer churn analysis may be seen below.

You may find the PowerBI file here.
In summary, The steps above are the core steps for data analysis. They may be re - ordered or amended as per your need. From here, you should consider learning and mastering power BI DAX functions and familiarizing yourself with different concepts of data analytics. It's important to remember that data analysis is not a one-size-fits-all solution, and your results will depend on a variety of factors. The best way to get the most value out of your data analysis is by embedding it in your business strategy.
Thank you for reading
Author: Gcinithemba Sherilyn Maphosa, Data Wired